Monitoring and Measuring the Built Historic Environment’s Pathway to Net Zero
Part of the Heritage Counts series. 5 minute read.
The UK Government has committed to reducing all greenhouse gas emissions by 100% by 2050 compared to 1990. This is the UK’s net zero target. Reducing carbon emissions from all sectors, including the built environment, is crucial to achieving this objective.
The UK’s carbon budgets
'The Climate Change Act (2008)' requires the UK Government to set legally binding ‘carbon budgets’ which act as stepping stones towards the 2050 net zero target (CCC, 2023a). A carbon budget is a cap on the total amount of greenhouse gases the UK can emit over a 5-year period. These restrictions are set at least 12 years in advance.
The UK met its first carbon budget (2008 to 2012) and its second carbon budget (2013 to 2017). It is on track to meet its third carbon budget (2018 to 2022):
- Provisional estimates indicate that emissions were 46% below 1990 levels in 2022, surpassing the reduction target of 38% (CCC, 2023b)
- The 2023 report suggests that to achieve the 2030 goal of at least a 68% fall in emissions from 1990 levels, the rate of emissions reduction outside of the power sector must almost quadruple (CCC, 2023b)
Buildings emit the UK's second highest greenhouse gas levels
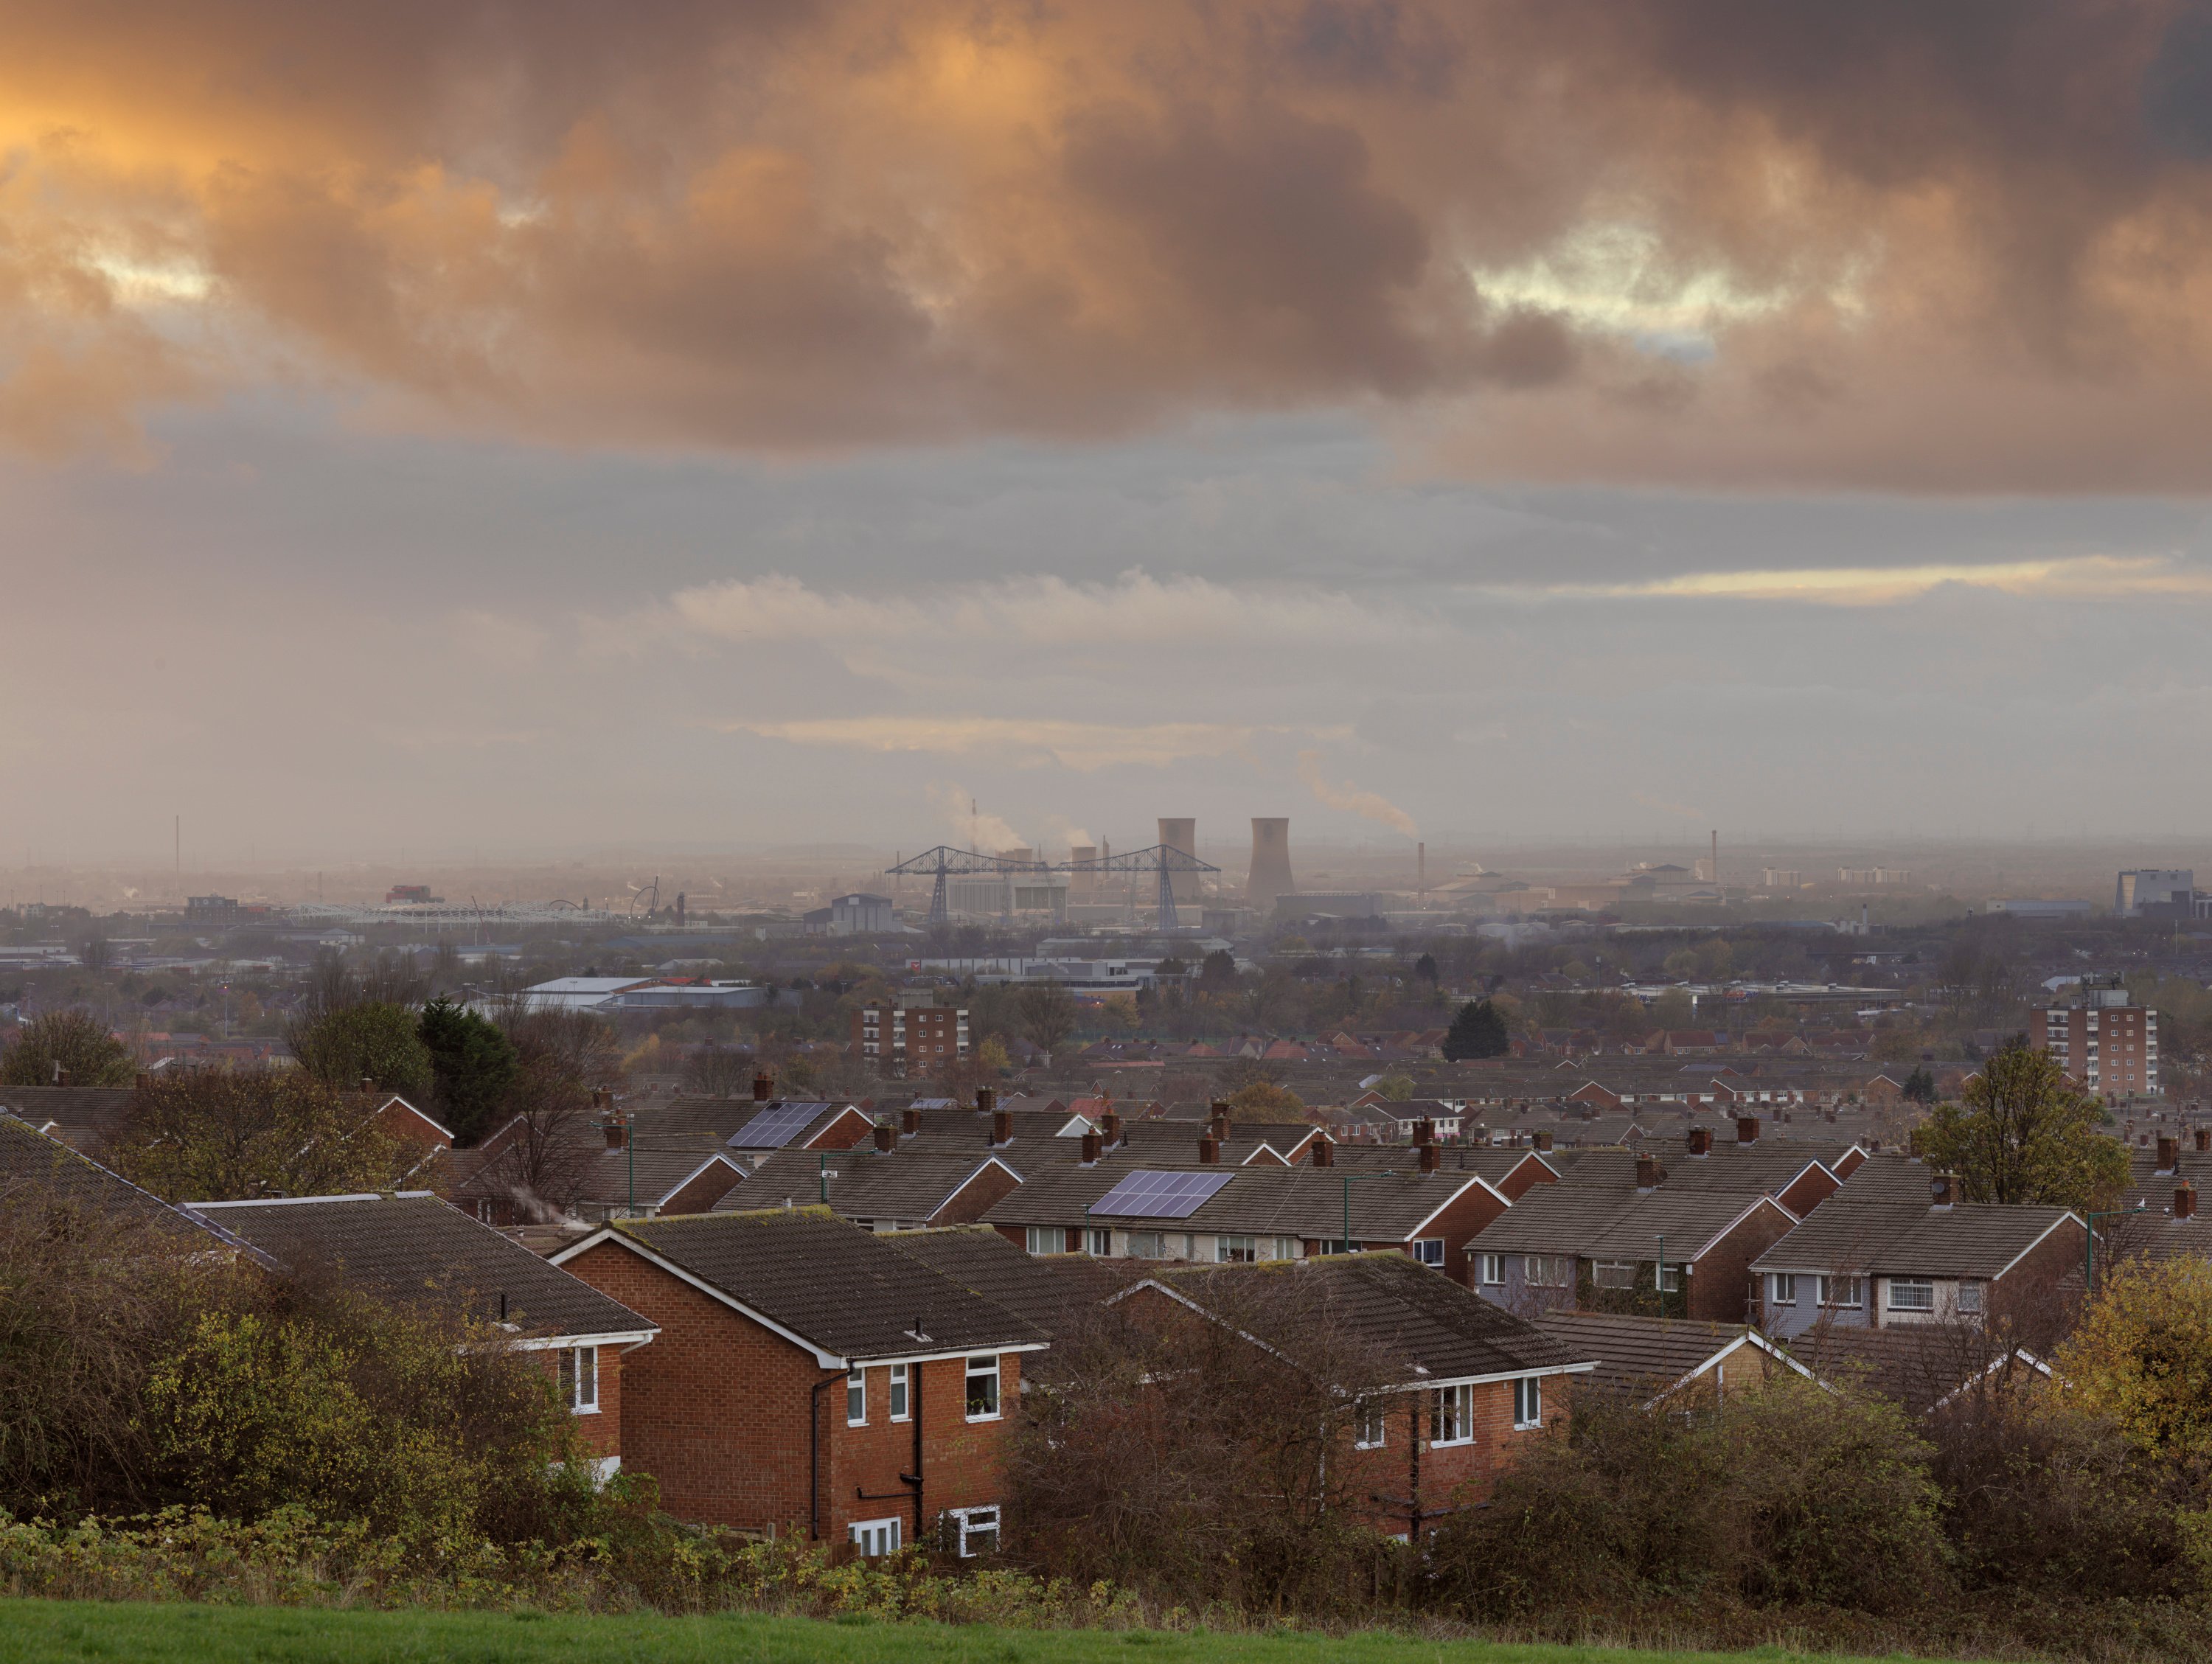
Buildings (including residential, public and commercial buildings) remain the UK’s second highest-emitting sector, accounting for 76 MtCO2e or 17% of total UK emissions in 2022 (CCC, 2023b). Surface transport is the highest emitting sector, accounting for 105 MtCO2e or 23% of UK emissions in 2022.
Direct building greenhouse gas emissions
Direct building greenhouse gas emissions (GHG) primarily stem from burning fossil fuels for heating accounting for 17% of all.
- Around 74% of the UK’s heating and hot water demand is met by natural gas, and 10% by petroleum
- 13% of the UK's total emissions in 2019 were from residential buildings. This is equivalent to 75% of all direct building carbon emissions
- Commercial buildings were responsible for 2.4% of the UKs total emissions, equivalent to 14% of direct emissions from buildings
- Public buildings emitted 1.5% of total UK emissions
Indirect building GHG emissions
When these are included buildings account for 23% of the UK total:
- Indirect emissions largely relate to electricity consumption, stemming from appliances and lighting in homes, and cooling, catering, and ICT equipment in non-residential buildings accounting for 6% of the UK's total emissions
- Buildings are responsible for 59% of UK electricity consumption, equivalent to a further 31 MtCO2e of emissions
Additional related emissions
In addition to the direct and indirect emissions from residential and non-residential emissions in the built environment also arise from elements of Manufacturing and Construction, Waste, F-Gases (such as fugitive emissions from refrigerants), and others (UKGBC, 2021).
- According to the UKGBC the direct and indirect emissions from buildings only account for 71% of the built environment’s greenhouse gas emissions
- The UKGBC’s whole life carbon road map estimates that 21% of the greenhouse gas emissions from the built environment are from the Construction, Maintenance & Demolition of non-domestic (10%) and domestic (11%) buildings
- 4% of the built environment’s emissions are from F-Gases (leakage from refrigeration, heat pumps and air conditioning plant within buildings)
Buildings are not on track to meet the government’s net zero targets
Progress remains broadly insufficient to ensure that the buildings sector reaches zero emissions by 2050 (CCC, 2023b).
According to the Climate Change Committee (CCC), progress in reducing greenhouse gas emissions from buildings has stalled since 2010 after significant progress between 1996 and 2008 (CCC, 2023b).
The CCC has called for the UK Government to urgently coordinate a shift in the energy use of residential and non-residential buildings in the UK. Reducing emissions from the built environment requires a holistic approach that includes all carbon over the whole building and infrastructure lifecycle.
Residential buildings
Greenhouse gas emissions from residential buildings fell by 6% in 2022 when temperature adjustments are made (CCC, 2023b):
- This is equivalent to a 16% decrease in emissions without temperature adjustments
- It is thought this decline was predominantly due to milder-than-usual winter months and behavioural responses to the record-high fossil fuel price
- While it is not possible to attribute specific data to historic buildings, it is important to note that historic buildings form a significant share of the residential stock: in 2023, there were 25.4 million residential buildings in England, of which 5.15 million or 20% were built before 1919 and considered to be traditionally built historic buildings (VOA, 2023)
Non-residential buildings
In 2022, greenhouse gas from non-domestic buildings increased by 5% after adjusting for temperature (CCC, 2023b):
- This was equivalent to a decline of 2% before temperature adjustments
- The change in emissions was driven by increases in emissions in public buildings, and there may be a contribution from an increase in office work following the pandemic (CCC, 2023b)
- Non-residential historic buildings are an important part of the non-residential stock, with 17% of Industrial stock, 33% of offices, 48% of retail and 30% of other commercial stock in England and Wales traditional methods (VOA, 2016)
References
- Climate Change Committee (2023a). ‘Advice on reducing the UK’s emissions - Climate Change Committee.’ Available at: https://www.theccc.org.uk/about/our-expertise/advice-on-reducing-the-uks-emissions/#:~:text=The%20Climate%20Change%20Act%20requires,over%20a%20five%2Dyear%20period (Accessed: 30.11.2023)
- Climate Change Committee (2023b). ‘Progress in Reducing Emissions 2023 Report to Parliament.’ Available at: https://www.theccc.org.uk/wp-content/uploads/2023/06/Progress-in-reducing-UK-emissions-2023-Report-to-Parliament-1.pdf (Accessed: 30.08.23)
- Climate Change Committee (2020b). ‘The Sixth Carbon Budget Buildings.’ Available at: https://www.theccc.org.uk/wp-content/uploads/2020/12/Sector-summary-Buildings.pdf (Accessed: 10.09.23)
- UKGBC (2021). ‘Net Zero Whole Life Carbon Roadmap.’ Available at: https://ukgbc.org/wp-content/uploads/2021/11/UKGBC-Whole-Life-Carbon-Roadmap-A-Pathway-to-Net-Zero.pdf (Accessed: 25.08.23)
- Valuation Office Agency (2023). ‘Council Tax: stock of properties, 2023.’ GOV.UK. Available at: https://www.gov.uk/government/statistics/council-tax-stock-of-properties-2023 (Accessed: 8.11.23)
- Valuation Office Agency (VOA) (2016). ‘Non-Domestic Rating: Stock of Properties by Sector in England and Wales on the 2010 Rating List.’ Available at: gov.uk/government/publications/non-domestic-rating-stock-of-properties-by-sector-in-england-and-wales-on-the-2010-rating-list (Accessed: 4.09.23)


